FORMAX
Traffic Changes after a New Bridge and Underground Expressway Opening
October 25, 2021

Han River, the biggest river in South Korea that runs across Seoul, recently had its 31st bridge, World Cup Bridge, open on September 1st. This newly added bridge connects Sangam, which neighbors Seoul World Cup Stadium, and Seobu Expressway (the western arterial expressway) in Yeongdeungpo district. Before opening, it drew a lot of worldwide attention after BTS’ performance on the bridge aired on the Tonight Show. One of the purposes of the bridge is to alleviate the extreme traffic jam of Seobu Expressway, especially during the commute hours, along with Seobu Underground Expressway that also opened on the same date as the bridge. Almost two months into their opening, we decided to see if they had been any successful in reducing traffic congestion by comparing the morning commute traffic before and after the opening.
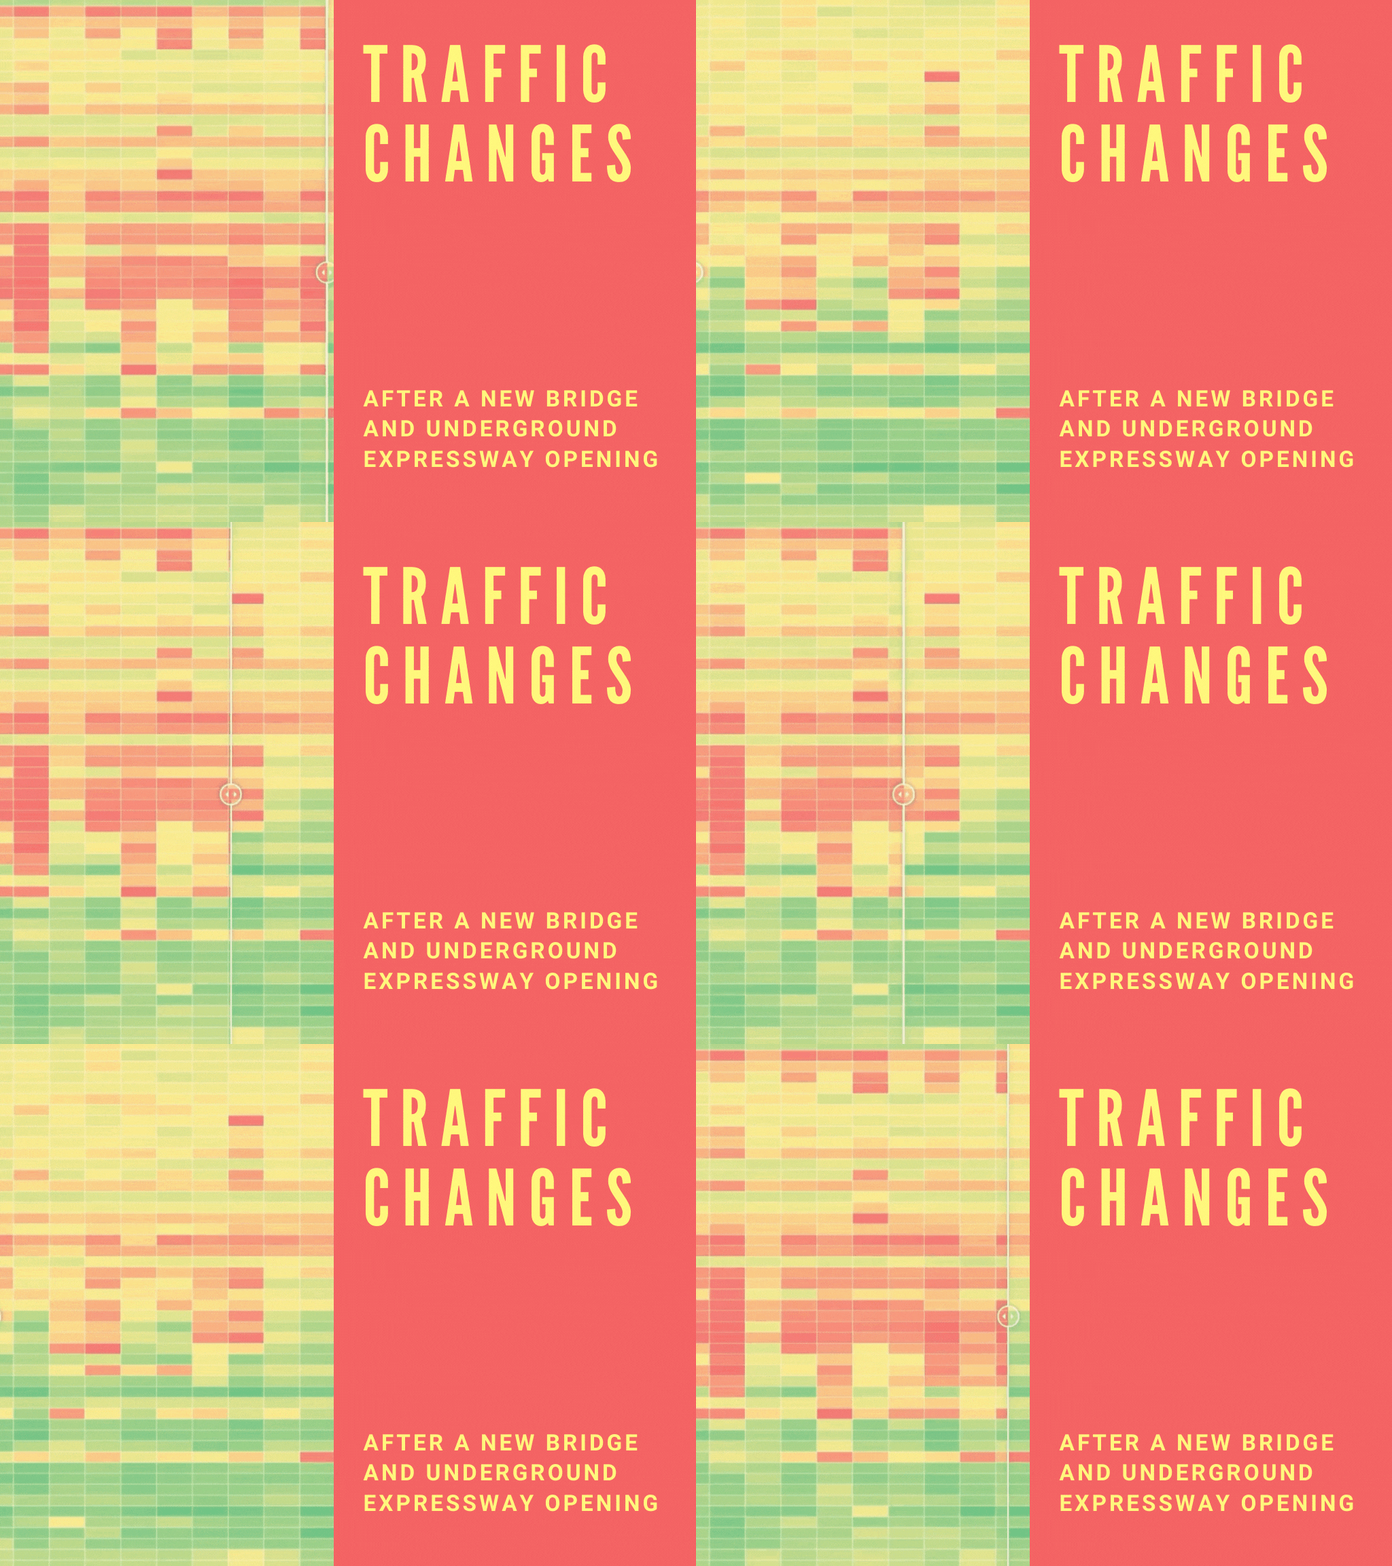
If you look at our data chart above, you can see that more than half of the expressway used to be congested (red to yellow), but after the opening, most of the traffic-heavy sections have improved after the World Cup bridge and Seobu Underground Expressway opened. Specifically, average traffic on the road section between Sinjeong-gyo and Mokdong-gyo during the morning commute hours has improved significantly from 17.41km/h to 30.21km/h. While most of the traffic-heavy areas have gotten lighter, the part of the road that enters Seongsan Bridge has gotten heavier in traffic from 59.96km/h to 37.10km/h on average.

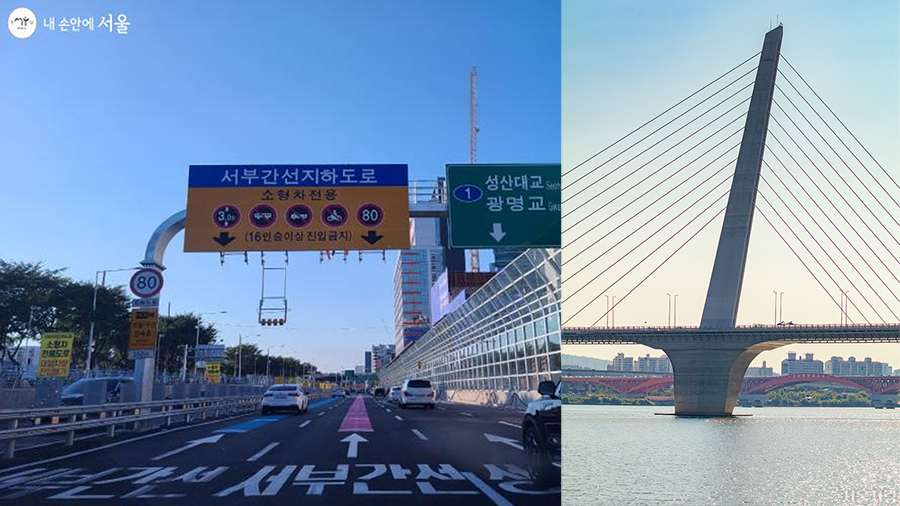
Photo of Seobu Expressway with an entrance sign to Seobu Underground Expressway, on the left, by Jo, Su-Yeon https://mediahub.seoul.go.kr/archives/2002712?tr_code=snews and photo of the World Cup Bridge, on the right, by Han, Hae-Ah https://opengov.seoul.go.kr/seoullove/23462821
It was confirmed through this data analysis that the morning commute traffic on business days got significantly better after the opening of the World Cup Bridge and Seobu Underground Expressway. It is expected to take a longer time for the new bridge and the new underground road to take full effect, but this is a positive start.
* One week of traffic data of 51 links out of 54 links that consist Seobu Expressway during each hour between 7 and 8am and 8 and 9am was collected, respectively from before World Cup Bridge and Seobu Underground Expressway opened (8/23 - 8/27) and after the opening (9/6 - 9/10). Weekend was not included. The average traffic data of each hour is represented by each colored cell on the chart. (Source: Formax Network)
If you look at our data chart above, you can see that more than half of the expressway used to be congested (red to yellow), but after the opening, most of the traffic-heavy sections have improved after the World Cup bridge and Seobu Underground Expressway opened. Specifically, average traffic on the road section between Sinjeong-gyo and Mokdong-gyo during the morning commute hours has improved significantly from 17.41km/h to 30.21km/h. While most of the traffic-heavy areas have gotten lighter, the part of the road that enters Seongsan Bridge has gotten heavier in traffic from 59.96km/h to 37.10km/h on average.

Photo of Seobu Expressway with an entrance sign to Seobu Underground Expressway, on the left, by Jo, Su-Yeon https://mediahub.seoul.go.kr/archives/2002712?tr_code=snews and photo of the World Cup Bridge, on the right, by Han, Hae-Ah https://opengov.seoul.go.kr/seoullove/23462821
It was confirmed through this data analysis that the morning commute traffic on business days got significantly better after the opening of the World Cup Bridge and Seobu Underground Expressway. It is expected to take a longer time for the new bridge and the new underground road to take full effect, but this is a positive start.
* One week of traffic data of 51 links out of 54 links that consist Seobu Expressway during each hour between 7 and 8am and 8 and 9am was collected, respectively from before World Cup Bridge and Seobu Underground Expressway opened (8/23 - 8/27) and after the opening (9/6 - 9/10). Weekend was not included. The average traffic data of each hour is represented by each colored cell on the chart. (Source: Formax Network)


